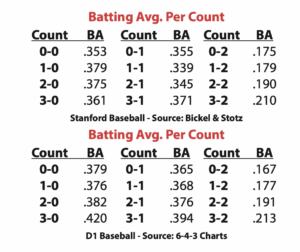
Every year in the post-season, the TV announcers seem to bring out a similar graphic. Flashing  on the screen is some version of this chart at right:
One look at this, and it seems pretty obvious that hitters do not want to get to two-strikes. Simple. Case closed.
This mind-set permeates the game: “Just don’t get to two strikes, anyway. Nothing good can happen there.” (Petriello-mlb.com) Players are always saying their favorite pitch is the first pitch. Coaches and parents are extolling (yelling at) their kids to attack the first good one they see.
The premise behind all this is the abject fear of two-strike hitting, and it’s backed up by data!
There is one problem though. These stats are flawed and don’t come close to telling the real story behind hitting success by count.
The Myth
Let’s start with a ground-breaking research study by J. Eric Bickel, a grad student at Stanford, and the Stanford assistant baseball coach Dean Stotz titled Batting Average by Count and Pitch Type. In the paper, they took four years of data and asked the question, “Why do hitters have such poor averages with two strikes?
“The answer to this dilemma lies in the definition of batting average and the fact that it was not created to be used within a plate appearance. Batting average is the number of hits divided by the number of at-bats. There are four ways to have an at-bat with less than two strikes: hit, error, fielder’s choice, or batted out (the ball has to be put in play). However, there are five ways to have an at-bat with two strikes: hit, error, fielder’s choice, batted out, and strikeout (the ball is either put in play or the batter strikes out).”
In short, batting average data by count is skewed because if you swing and miss with 0 strikes, it does not count against your batting average by count. If you swing and miss with two strikes, it is considered an 0-for-1. The insight accrued from such misleading data gives an incorrect picture into how well hitters actually hit in different counts.
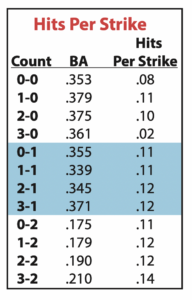
Thus, BA by count is completely flawed. To really get a sense of how hitters hit, let’s look at Hits Per Strike. Here is the data they compiled:

While BA goes significantly down with two strikes, Hits per Strike actually improves with two strikes! When a strike is thrown, hitters hit .099 with less than two strikes, but .123 with two strikes. As Bickel and Stotz put it, “Batters are more likely to get a hit (off a pitch thrown for strike) with two strikes than other counts. This is exactly the opposite relationship as suggested by BA by count.”
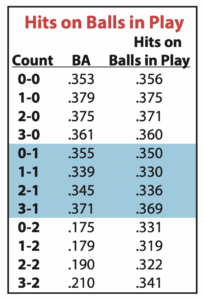
There’s an additional way of looking at it. What is the average of hits when the hitter puts the ball in play (this takes out misses and fouls)? Below are the results:

When batters put the ball in play, hitters get more hits earlier in the count as opposed to later in the count. They have a higher chance of getting a hit with less than two strikes (.353), versus putting it in play with two strikes (.326). In a way, this mirrors the decline seen in BA as counts get deeper and seems to validate BA by count.
There’s one catch though according to Bickel and Stotz: “This difference of .027 is a real effect. Batters are less likely to get a hit if they put the ball in play with two strikes. However, it is hardly the dramatic effect suggested by BA.” Indeed, while BA by count data states that batters hit up to .200 points lower with two strikes versus no strikes, by looking at the more appropriate Hits on Balls in Play stat, they only hit max .050 points lower.
Let’s look at some more data.
The same holds true when looking at the traditional concept of ahead (1-0, 2-0, 3-0, 2-1, 3-1, 3-2), even (0-0, 1-1, 2-2) and behind the count (0-1, 0-2, 1-2). Batters hit .313 ahead in the count, .285 when even, and .218 when behind, yet while Hits Per Strike and Hits on Balls in Play both went down as the count got deeper, it only went down 19 and 25 points respectively, hardly the 95 points that BA states.
Conclusion
Batting Average by count data is a flawed stat that is incorrectly negatively impacting the approach and mindset of hitters. By using the data appropriately, it is clear that there is a myth around batting average by count.
“Batting average and slugging percentage by count are highly misleading, because they imply that batters perform poorly with two strikes or incredibly well with less than two strikes,” state Bickel and Stotz. “The low BA and SLG numbers with two strikes (less than two strikes) are simply defects of these statistics.”
Actionable Summary:
This information is incredibly powerful for hitters to be aware and utilize in their game. Despite all the rhetoric and common teachings, if you only swing at strikes, you actually hit better with two strikes. And when you put the ball in play, you hit a little better with less than two strikes, but not much.
There are many reasons that would seem to validate why this is true:
• Hitters have no basis for distinction on speed of pitches when they first get in the box. As the at-bat continues, they “learn” the speeds and are able to time-up pitches better.
• When hitters first get in the box, the footing can be off, the background and lighting can be off, the pitchers motion can be different.
• Also, hitters tend to be less focused and committed early in the count, as the penalty for swings and misses are less.
This is really a conversation about hitting with less fear. With this knowledge, hitters can be less afraid of two strikes, as well as more selective with less than two strikes. If hitters really know the strike zone with two strikes, they’ll hit well and don’t have to be defensive.
In turn, hitters can trust themselves and not be afraid of hitting with two strikes!
For more data, see the article Batting Average by Count and Pitch Type, by J. Eric Bickel and Dean Stotz, originally published in the Baseball Research Journal.


